Lucidchart (ER diagrams)

Best Self Hosted Alternatives to Lucidchart (ER diagrams)

A curated collection of the 2 best self hosted alternatives to Lucidchart (ER diagrams).

Lucidchart is a web-based diagramming SaaS for creating ER diagrams and database schemas. It lets teams design, visualize, and document entity-relationship models with real-time collaboration, import/export and integrations to streamline database planning and communication.

Alternatives List

#1
ChartDB

ChartDB

ChartDB generates interactive ER diagrams by introspecting your SQL database schema, helping teams document, explore, and share table relationships and metadata.

ChartDB screenshot

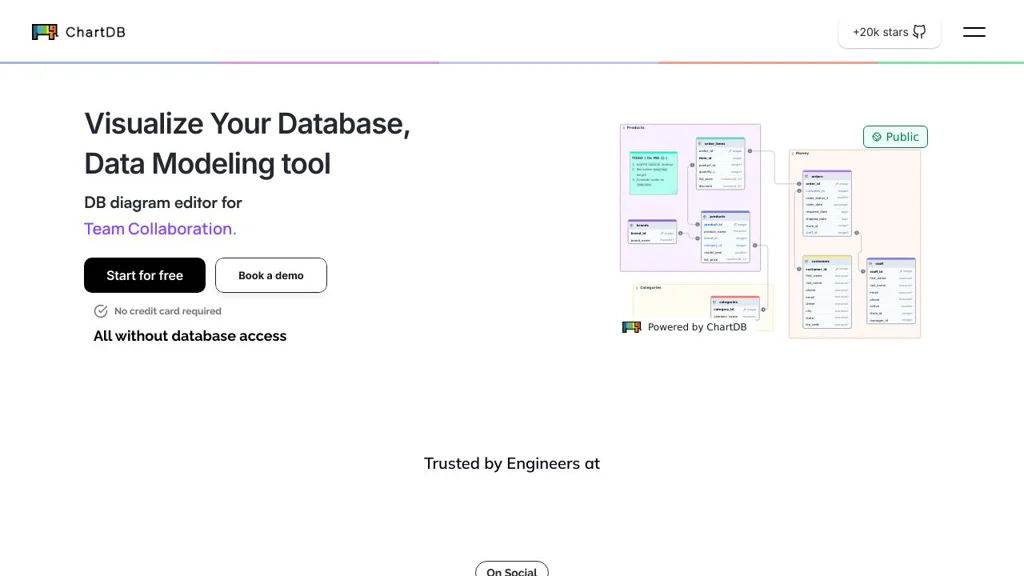
ChartDB is a web app for turning an existing SQL database into an ER diagram you can explore and share. It connects to a database, introspects tables/columns/keys, and renders an entity-relationship view to help you understand and document data models.

Key Features

  • Schema introspection to discover tables, columns, indexes, and relationships
  • Interactive ERD visualization for navigating database structure
  • Supports multiple relational databases via connection configuration
  • Diagram organization features for clearer, shareable schema documentation
  • Designed for quick onboarding and understanding of legacy databases

Use Cases

  • Document a production database schema for engineering and analytics teams
  • Speed up onboarding by providing a visual map of tables and relationships
  • Review and communicate schema changes during refactors or migrations n ChartDB is a practical tool for teams that need a fast, visual understanding of relational schemas. By generating diagrams directly from the source database, it reduces manual documentation effort and keeps schema knowledge easier to maintain.
20.8kstars
1.2kforks
#2
draw.io (diagrams.net)

draw.io (diagrams.net)

diagrams.net (draw.io) is a web-based diagramming tool for flowcharts, UML, ER diagrams, and more, with integrations and offline/desktop options.

draw.io (diagrams.net) screenshot

diagrams.net (formerly draw.io) is a diagramming and flowcharting application for creating technical and business diagrams in the browser. It focuses on fast editing, broad diagram types, and easy export/sharing, with integrations commonly used in engineering documentation workflows.

Key Features

  • Drag-and-drop editor with extensive shape libraries (flowcharts, UML, BPMN, network diagrams, org charts, etc.)
  • Diagram-as-a-file approach: save as .drawio/XML and import/export across environments
  • Export to PNG/JPEG/SVG/PDF and embed diagrams into documents and wikis
  • Connectors, layers, groups, alignment tools, and style controls for precise layouts
  • Templates and reusable custom libraries for standardized diagramming
  • Integrations and embedding options commonly used with platforms like Confluence/Jira and Git-based documentation
  • Desktop app availability (Electron) for offline editing and local file workflows

Use Cases

  • Software architecture diagrams (C4-style), UML, and sequence/flow diagrams for engineering teams
  • Network/topology diagrams and infrastructure documentation
  • ER diagrams and process maps for product, operations, and compliance documentation

Limitations and Considerations

  • Real-time multi-cursor collaboration depends on the chosen integration/storage backend; the core editor is primarily file-centric.
  • Large/complex diagrams can become heavy in the browser depending on client resources.

A major advantage of diagrams.net is its lightweight, file-based model and wide export compatibility, making it easy to adopt in existing documentation pipelines. It suits both ad-hoc diagramming and repeatable, standardized diagram creation through templates and libraries.

3.3kstars
579forks

Why choose an open source alternative?

  • Data ownership: Keep your data on your own servers
  • No vendor lock-in: Freedom to switch or modify at any time
  • Cost savings: Reduce or eliminate subscription fees
  • Transparency: Audit the code and know exactly what's running