New Relic

Best Self Hosted Alternatives to New Relic

A curated collection of the 4 best self hosted alternatives to New Relic.

New Relic is an observability and telemetry SaaS platform that provides application performance monitoring (APM), infrastructure monitoring, metrics, traces, logs, real user monitoring, alerting and dashboards to help teams monitor, troubleshoot, and optimize applications and systems.

Alternatives List

#1
Netdata

Netdata

High-resolution real-time monitoring for servers, containers, and apps with interactive dashboards, alerting, and extensive integrations for troubleshooting and observability.

Netdata screenshot

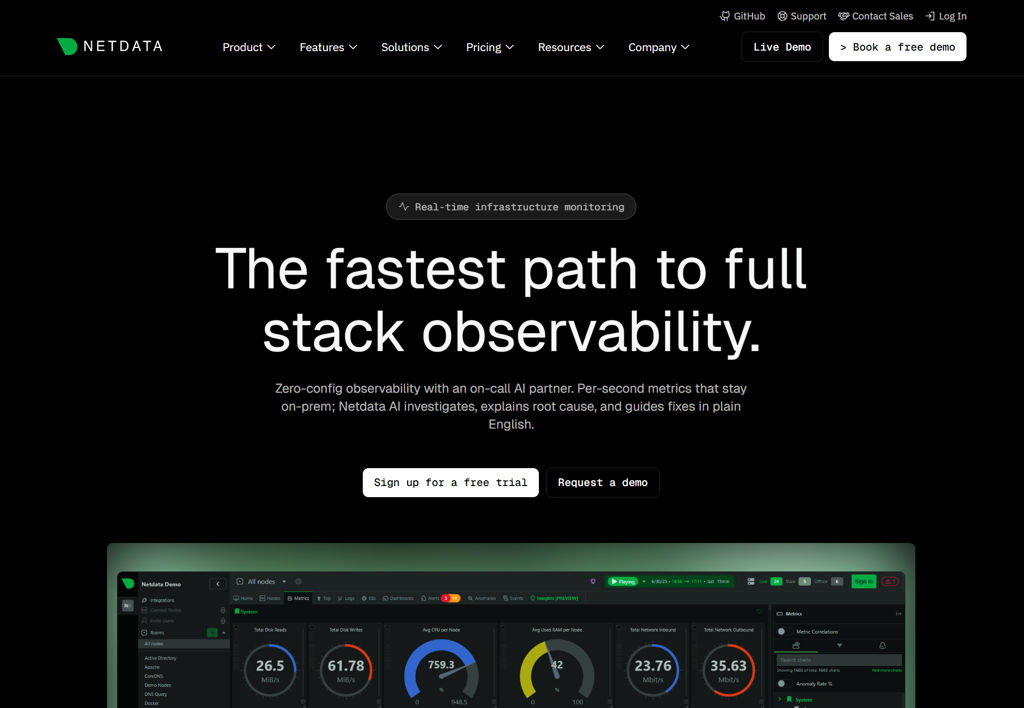
Netdata is a real-time performance monitoring and troubleshooting platform for hosts, containers, and applications. It collects high-frequency metrics, visualizes them in interactive dashboards, and helps operators detect anomalies and investigate incidents quickly.

Key Features

  • High-resolution, per-second (and finer) metric collection with low-latency visualization
  • Interactive web dashboards with drill-down charts, correlations, and per-dimension views
  • Large library of collectors/plugins for OS, containers, databases, web servers, and common services
  • Health/alerting engine with configurable alarms and notifications (via popular notification channels)
  • Metrics export/streaming to external time-series/observability systems (commonly Prometheus/OpenMetrics, Graphite, InfluxDB, and others)
  • Distributed setups with agents and optional centralized aggregation/streaming (Netdata “streaming”)
  • Auto-discovery for many environments and integrations (including Kubernetes)

Use Cases

  • Troubleshoot sudden CPU, memory, disk I/O, or network regressions on Linux servers in real time
  • Monitor containers/Kubernetes nodes and quickly correlate resource saturation with specific services
  • Build alerting for infrastructure and application health signals and route notifications to on-call channels

Limitations and Considerations

  • Long-term retention and advanced historical analytics typically rely on external storage/backends rather than the agent alone
  • Some advanced features in Netdata’s ecosystem may be oriented around the vendor Cloud offering, depending on the deployment approach

Netdata is well-suited for operators who need immediate visibility into system performance and fast root-cause analysis. Its strength is high-frequency metrics plus an opinionated troubleshooting UI, complemented by broad integrations for alerting and exporting data to existing observability stacks.

77.3kstars
6.3kforks
#2
Umami

Umami

Self-hosted web analytics with a clean dashboard, event tracking, and privacy-first data collection as an alternative to Google Analytics.

Umami screenshot

Umami is a self-hosted web analytics platform designed to provide essential website insights with a simple UI and a privacy-focused approach. It offers real-time traffic monitoring, pageview and referrer analytics, and optional event tracking without relying on complex setups.

Key Features

  • Clean analytics dashboard with real-time visitors and traffic trends
  • Page, referrer, device, browser, OS, and country-level breakdowns
  • Event tracking for custom actions and conversions
  • Multi-website support and user/team access management
  • Shareable dashboards via public links (optional)
  • Data filtering (e.g., by URL, referrer, country/device) for analysis
  • Runs on common databases (PostgreSQL or MySQL) with Docker deployment options
  • JavaScript tracking script with lightweight client footprint

Use Cases

  • Replace Google Analytics for privacy-conscious site owners
  • Track marketing campaign performance via referrers and UTM parameters
  • Monitor product or content engagement using custom events

Limitations and Considerations

  • Focuses on core web analytics; advanced product analytics features (e.g., heatmaps/session replay) are out of scope

Umami fits teams and individuals who want straightforward web analytics, easy deployment, and ownership of their data. It is especially suitable for blogs, documentation sites, SaaS marketing pages, and internal web properties where lightweight tracking and clarity matter most.

34.6kstars
6.2kforks
#3
Healthchecks

Healthchecks

Monitor cron jobs and background tasks by pinging unique URLs. Get alerts for missed runs, failures, and long runtimes via email, SMS, and popular integrations.

Healthchecks screenshot

Healthchecks is a cron job and background task monitoring service built around simple “ping” URLs. You add a check, instrument your job to call the provided endpoint, and Healthchecks tracks schedules, runtimes, and failures to alert you when something goes wrong.

Key Features

  • Ping-based monitoring for cron jobs, one-off scripts, and background workers (success, fail, and start signals)
  • Flexible scheduling (period/grace time) with detection of missed runs and late jobs
  • Status signals: success, failure, and “start” to detect long-running/hung tasks
  • Notification channels including email and multiple third-party integrations (webhooks and chat/incident tools)
  • Teams and projects with role-based access for multi-user setups
  • Maintenance periods / downtime handling and per-check pause controls
  • Check-level API and management UI for creating and maintaining checks
  • Timezone-aware reporting and history of pings/runs for troubleshooting

Use Cases

  • Alert when backups, database maintenance, or ETL pipelines don’t run on schedule
  • Track long-running batch jobs and detect hangs using “start” + timeout
  • Monitor periodic health tasks in container/Kubernetes environments via HTTP pings

Limitations and Considerations

  • Healthchecks monitors scheduled execution via pings; it is not a full infrastructure/metrics APM system.

Healthchecks is a lightweight, reliable way to get notified about missed or failed scheduled jobs without deploying a full monitoring stack. It works well for ops teams and developers who want simple instrumentation, clear run history, and flexible alert routing.

9.8kstars
940forks
#4
Statping-ng

Statping-ng

Statping-ng is an uptime monitoring and status page platform for tracking HTTP and other service checks, sending alerts, and publishing incident updates.

Statping-ng screenshot

Statping-ng is a self-hosted uptime monitoring service with a built-in public status page. It runs scheduled health checks against your services, stores results, and can notify you when incidents occur, making it suitable for small teams and homelabs.

Key Features

  • Public status page with service groups, incident posts, and historical uptime
  • Scheduled health checks (primarily HTTP/HTTPS; additional check types available depending on configuration/version)
  • Notification/alerting integrations (e.g., email and common chat/push providers)
  • Multi-user administration with roles/permissions
  • Metrics and charts for response time and uptime history
  • API for managing services/checks and status content
  • Runs in a single binary/container with support for common databases

Use Cases

  • Publish a public status page for customer-facing services and APIs
  • Monitor internal services (reverse proxies, apps, endpoints) and alert on downtime
  • Track SLA/uptime history for infrastructure changes and maintenance

Limitations and Considerations

  • Feature set and integrations can vary across releases/forks; verify supported check types and notifiers for your target version.

Statping-ng is a practical option when you want both uptime checks and a simple status page in one deployable service. It focuses on lightweight monitoring, incident communication, and straightforward alerting rather than full observability.

1.9kstars
181forks

Why choose an open source alternative?

  • Data ownership: Keep your data on your own servers
  • No vendor lock-in: Freedom to switch or modify at any time
  • Cost savings: Reduce or eliminate subscription fees
  • Transparency: Audit the code and know exactly what's running