
Netdata
Real-time infrastructure monitoring and troubleshooting
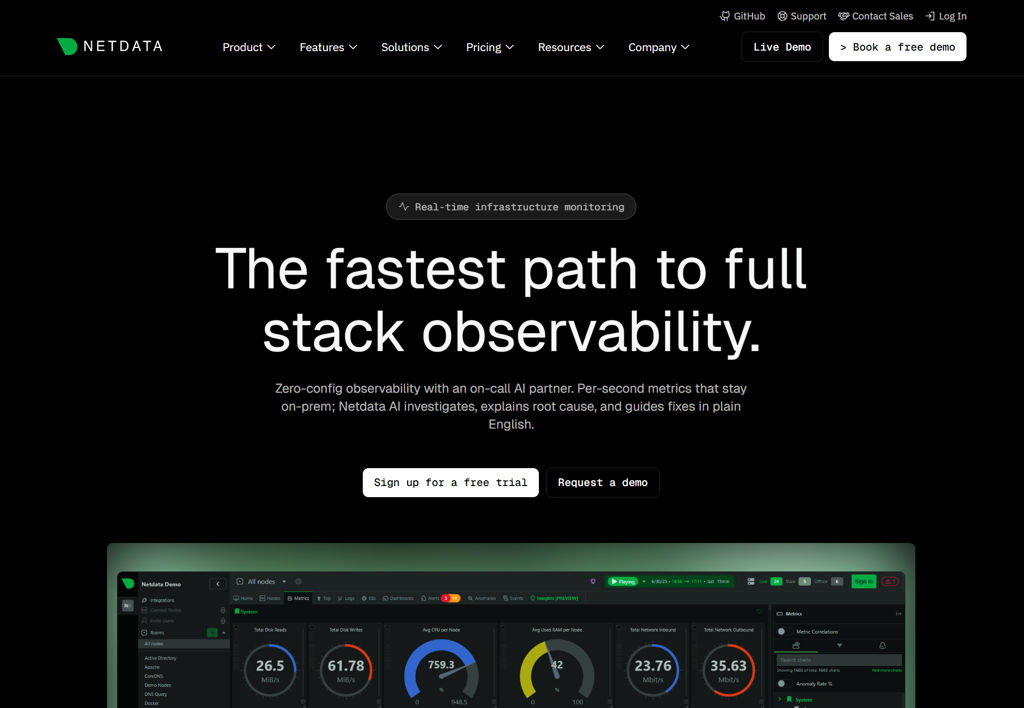
Netdata is a real-time performance monitoring and troubleshooting platform for hosts, containers, and applications. It collects high-frequency metrics, visualizes them in interactive dashboards, and helps operators detect anomalies and investigate incidents quickly.
Key Features
- High-resolution, per-second (and finer) metric collection with low-latency visualization
- Interactive web dashboards with drill-down charts, correlations, and per-dimension views
- Large library of collectors/plugins for OS, containers, databases, web servers, and common services
- Health/alerting engine with configurable alarms and notifications (via popular notification channels)
- Metrics export/streaming to external time-series/observability systems (commonly Prometheus/OpenMetrics, Graphite, InfluxDB, and others)
- Distributed setups with agents and optional centralized aggregation/streaming (Netdata “streaming”)
- Auto-discovery for many environments and integrations (including Kubernetes)
Use Cases
- Troubleshoot sudden CPU, memory, disk I/O, or network regressions on Linux servers in real time
- Monitor containers/Kubernetes nodes and quickly correlate resource saturation with specific services
- Build alerting for infrastructure and application health signals and route notifications to on-call channels
Limitations and Considerations
- Long-term retention and advanced historical analytics typically rely on external storage/backends rather than the agent alone
- Some advanced features in Netdata’s ecosystem may be oriented around the vendor Cloud offering, depending on the deployment approach
Netdata is well-suited for operators who need immediate visibility into system performance and fast root-cause analysis. Its strength is high-frequency metrics plus an opinionated troubleshooting UI, complemented by broad integrations for alerting and exporting data to existing observability stacks.
Categories:
Tags:
Tech Stack:
 eBPF
eBPF JavaScript
Similar Services

Uptime Kuma
Self-hosted uptime monitoring and alerting dashboard
Self-hosted uptime monitoring for websites, APIs, and services with status pages, rich notifications, and multi-protocol checks.

Umami
Simple, fast, privacy-focused web analytics
Self-hosted web analytics with a clean dashboard, event tracking, and privacy-first data collection as an alternative to Google Analytics.

ChangeDetection.io
Monitor websites for changes and get notifications.
Self-hosted website change detection and monitoring with visual diffs, filters, and notifications via email and popular chat/webhook services.

ntfy
Send notifications to your phone or desktop via HTTP and pub/sub
Self-hostable publish/subscribe notification service with HTTP API, web UI, and mobile apps for push alerts from scripts, CI, monitoring, and automations.


Plausible Analytics
Simple, privacy-friendly web analytics
Lightweight, privacy-focused web analytics with a single-page dashboard, event/goal tracking, and easy integrations as a Google Analytics alternative.

Dashy
A customizable dashboard for your homelab and services
Dashy is a configurable self-hosted start page for organizing apps, links, widgets, and status checks with themes, auth, and integrations.